I like Cilium’s host firewall a lot. I wanted that model for our microVM orchestrator, but Cilium is built for Kubernetes and the orchestrator’s hosts are not Kubernetes nodes. So I wrote a firewall policy and networking stack in eBPF for it, taking my design cues from Cilium.
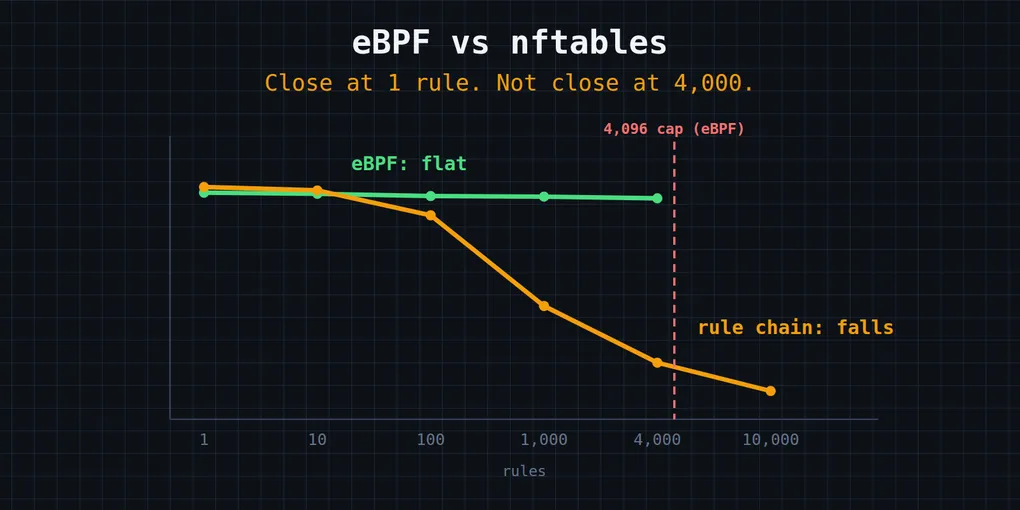
I assumed mine would be faster than nftables, so I measured it. The result was mostly good news, plus one embarrassing row and one thing I never measured. This post does not benchmark Cilium. It compares my firewall against a plain rule chain.
The firewall filters traffic for microVMs on bare-metal hosts. Each guest gets a policy, and small eBPF programs attached to the network interfaces enforce it in the kernel. My first benchmark numbers covered only my own code, which proves about as much as grading your own exam. For this post I ran both mechanisms through the same harness.
Below you will find the harness, the range where the two are close, the range where they are not, and the limits of what I can claim. If you are choosing between a rule list and a map-based design, read the curve before any single number.
New to this? What are eBPF and nftables, in one paragraph?
Both make the Linux kernel allow or drop network packets. nftables (and the older iptables, which now runs on top of it) keeps rules in an ordered chain, and the kernel walks the chain from the top until a rule matches. eBPF lets you load a small program into the kernel and attach it to a network interface. The program looks things up in a map (a kernel data structure such as a hash table or a trie) and decides in one lookup, however many rules sit behind it.
What I measured
Both mechanisms had to filter the same traffic in the same place, so I would not be comparing my numbers against someone else’s published ones.
The rig is two network namespaces joined by one virtual ethernet pair. A UDP echo client in one namespace talks to an echo server in the other. The filter sits on the server side of the pair, where it sees both directions of every round trip.
- eBPF side: my compiled programs, attached the way production attaches them. No stand-in code written for the benchmark.
- Rule-chain side: N-1 rules that never match, then a final ACCEPT. A list handles this worst case badly, since every packet walks the whole chain. I installed the rules with the
iptablescommand, which runs on the nftables stack on a modern system. - Rule counts: 1, 10, 100, 1,000, 4,000 and 10,000.
- Per rule count: latency percentiles (5,000 samples, one packet in flight), throughput (8 concurrent senders for 3 seconds), and CPU cycles per packet (system-wide
perf statover the same 3 seconds).
Everything ran in disposable namespaces on a bare-metal test host (Linux 6.8), away from the host’s real interfaces.
New to this? What is a network namespace, and why use one for a benchmark?
A network namespace is a private copy of the kernel’s network stack, with its own interfaces, routes and firewall rules. Two namespaces joined by a virtual cable behave like two machines on a LAN. For a benchmark that gives you a clean, repeatable setup you can delete afterwards. It also changes what a mistake costs: a bad firewall rule inside a namespace locks out the namespace, and on a remote host it locks out you.
Results from 1 to 100 rules: close
At the low end the two are neck and neck, and the rule chain wins slightly. At one rule, iptables beat my eBPF firewall by about 5% in throughput. I would have liked a different answer, and the table does not offer one.
| Rules | eBPF pps | rule chain pps | eBPF p50 latency | rule chain p50 latency |
|---|---|---|---|---|
| 1 | 161,966 | 170,252 | 18,956 ns | 17,440 ns |
| 10 | 160,343 | 166,622 | 19,454 ns | 29,918 ns |
| 100 | 157,124 | 135,872 | 20,475 ns | 18,091 ns |
The one-rule row surprised me. With almost nothing to evaluate, the filter is a small slice of each packet’s cost. Socket calls and scheduling dominate both paths about equally, so a cheaper filter barely shows. The chain’s 10-rule latency (29,918 ns) is worse than its 100-rule latency (18,091 ns), which no trend explains. That is noise, and I’m leaving it in because a benchmark that hides its odd data points isn’t worth trusting.
By 100 rules the chain has begun to slip (170k down to 136k packets per second), but latency doesn’t show it yet.
Results from 1,000 rules: not close
| Rules | eBPF pps | rule chain pps | eBPF cycles/pkt | rule chain cycles/pkt |
|---|---|---|---|---|
| 1 | 161,966 | 170,252 | 76,279 | 70,635 |
| 100 | 157,124 | 135,872 | 80,179 | 90,698 |
| 1,000 | 156,522 | 57,660 | 79,661 | 176,754 |
| 4,000 | 154,114 | 25,562 | 82,597 | 357,086 |
| 10,000 | not run | 11,871 | not run | 748,607 |
At 4,000 rules the eBPF path pushes about 6x the packets per second and spends about 4.3x fewer CPU cycles per packet. Median round trip is 27 µs against 77 µs, and p99 is 58 µs against 123 µs. At 10,000 rules the chain managed 11,871 packets per second. It is still a firewall, technically.
The cycles column tells you the most. It counts everything on the machine during the test, including the echo client, the echo server and the socket calls, so the roughly 76,000 cycles at one rule is mostly not the filter. The filter is a passenger. Use the one-rule row as the baseline:
- eBPF went from 76,279 to 82,597 cycles per packet at 4,000 rules, about 6,300 more.
- The rule chain went from 70,635 to 357,086, about 286,000 more.
Four thousand rules add about 8% to the eBPF baseline. They add about 400% to the chain’s.
New to this? What are pps and “cycles per packet”?
pps is packets per second, the number of packets the whole path can push through. Cycles per packet is how many CPU clock ticks it takes to handle one. Fewer cycles per packet leaves more headroom for everything else on the machine, which is why I weigh it as heavily as raw speed. A firewall that is fast enough but burns four times the CPU takes that CPU from your actual workload.
Why the curves look like that
A rule chain is a list. The kernel checks rules in order, so a packet that matches nothing pays for every rule, and the cost grows linearly with the rule count. My benchmark uses that worst case on purpose.
The eBPF side doesn’t walk rules. Policy compiles into a map keyed on peer and port, and each packet does a fixed number of lookups. The map is a longest-prefix-match trie, so lookup cost depends on the depth of the key and not on the size of the table. That keeps the line flat.
I also checked that the flat line survives at real table sizes. I loaded a policy of 4,000 compiled rows plus 8,000 entries in the identity cache, then looked up the entry inserted last, which is the worst case for an insertion-ordered structure.
| Lookup | 1 entry | 4,000 / 8,000 entries | Change |
|---|---|---|---|
| New flow (full lookup) | 5,282 ns | 5,471 ns | +3.6% |
| Established flow | 4,935 ns | 5,154 ns | +4.4% |
| Host bypass (cache only) | 4,896 ns | 4,867 ns | within noise |
These figures come from running the compiled program directly with the kernel’s test-run facility, one run per call, so they include some harness overhead. Treat them as relative numbers. Going from 1 entry to the real table size moved the cost by a few percent.
The cap I chose
The eBPF side has no 10,000-rule row because of a limit I set myself.
An eBPF map is declared with a fixed maximum size when the program loads, and the kernel refuses inserts beyond it. My policy map holds 4,096 compiled entries. The control plane checks the same number before it pushes a policy, so an oversized rule set gets rejected with a clear error instead of being half-applied. The rule chain declares no limit, which is why it ran at 10,000.
The cap counts compiled entries, not the rules a person writes. A port range can expand into several entries, so a short written policy can still hit the limit.
I picked 4,096. The kernel didn’t ask for it, and I’d like to claim a deeper reason, but it is a power of two and it was enough. For this use case it leaves plenty of room, and nothing in the benchmark pushed on it. Raising it means changing one constant on each side, and I’ll revisit it if a real policy gets close.
New to this? Why do eBPF maps need a fixed size?
The kernel allocates and manages map memory itself, and it needs the limit up front so a runaway program can’t consume unbounded memory in kernel space. You declare the maximum when you define the map. In exchange you get predictable memory use and lookup cost, and you choose your limit in advance.
What I did not measure
Treat this section as the terms and conditions for the rest of the post.
No live VM was in the loop. In production the microVM monitor does its own per-packet work in front of this filter, and my harness has no monitor, so I can’t say how much of the filter’s cost that work hides. I considered building a guest with live traffic and decided it was out of proportion for a performance task on a shared host. The question stays open.
Everything ran on one box. Real traffic arriving on a physical NIC takes a different path from traffic between namespaces, and some of my end-to-end checks had to be skipped for that reason.
UDP echo is a narrow workload. It stresses per-packet cost and says nothing about long-lived TCP connections, large flows or connection tracking.
Updates cost something. Replacing a live policy at the 4,000-entry ceiling took about 26 ms, dominated by inserting entries one at a time (roughly 6.5 µs each). That scales close to linearly and sits well inside my apply budget. There is no incremental patching: every change recompiles and swaps the whole map. A list-based firewall has different update costs, and I didn’t compare them.
What I’d take from this
Measure at the rule count you run. A benchmark at one or ten rules would have told me the two are the same, and I’d have shipped on the hunch anyway. The interesting behavior only shows up at your real sizes.
Report the row where you lose. The chain was ahead at one rule, so if you filter a handful of addresses, nothing here says eBPF is worth the complexity. The case for it is a rule set that grows. If you take the flat line, you also take a fixed-size map, so choose the cap deliberately and write down that it is a choice.
My own gap is the live VM path, and I’d sooner publish the gap than a tidier story. If you are building something similar, or you know a better way to measure the part I left out, I’d like to hear about it.