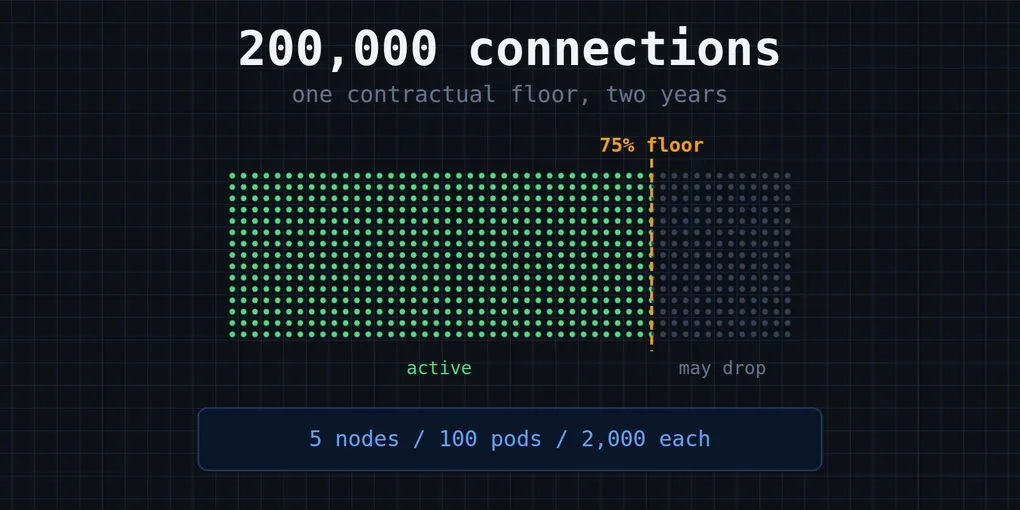
A client came to me with a simple requirement: maintain 200,000 persistent WebSocket connections, stable, 24/7, and never let active connections drop below 75% of the total outside planned maintenance. Not a soft target. A hard contractual floor.
Before you read further: this wasn’t a high-throughput messaging platform. The connections were predominantly receiving data with minimal outbound payload. The engineering challenge was connection stability and cost, not throughput. If you came here expecting Kafka-scale message processing numbers, this is a different kind of problem. I’m also going to stay abstract about what the connections were for and who the client was. The infrastructure is the story here, not the product.
This is the story of how I built it, broke it, rebuilt it properly, and held that 75% floor in production for two years, outside planned maintenance. It was also my first time setting up a Kubernetes cluster from scratch and running production workloads on it. I watched CPU graphs and made calls based on what I saw. It worked.
v1: The Naive Approach
The first prototype was straightforward. A TypeScript client, credentials loaded from a database, loop through them and open connections. I threw 10,000 connections onto a $20 DigitalOcean VPS with 4GB of RAM and 4 cores.
I built a small monitoring endpoint to track what percentage were actually up. Watched it hover around 60–70%, and dropping.
The problem was CPU throttling. Shared VPS, noisy neighbors, and the moment the CPU got throttled, connections started dying faster than they were being re-established. Not a code problem. A resources problem. And already below the floor before I’d even hit the full target count.
Moving to Kubernetes
I was a solo operator managing five nodes. I didn’t want to SSH into five boxes at 5am to figure out why MongoDB was down on node 3. Kubernetes gave me a single control plane, automatic rescheduling, and a way to mark a node unresponsive without manually migrating workloads by hand. The client’s 75% floor made Kubernetes not a nice-to-have but a practical necessity. I needed the cluster to self-heal without me babysitting it.
I moved to k3s on Hetzner AX-41 bare metal nodes. Real dedicated hardware, no throttling surprises.
Finding the Ceiling Before Planning Capacity
Before any capacity planning, I needed to understand what a single pod could actually handle. I started with one deployment and began experimenting methodically.
Loaded 500 connections onto a pod, watched CPU and RAM through Rancher’s monitoring stack. Stable. Pushed to 1,000. Still fine. 1,500: CPU started showing spikes during handshakes. 2,000: spikes, but settling cleanly after each handshake completed. 2,500: the spikes started bleeding into the next handshake cycle, and connections began dropping.
The 10-second delay between each handshake was the key variable. That gap exists to pace connection establishment: too many handshakes in flight at once means CPU spikes stack on top of each other. At 2,000 connections per pod, the spikes were isolated. Each one had room to resolve before the next began. CPU could burst up to a full core during the spike and settle back down comfortably.
2,000 per pod was the answer.
The second question was what memory looked like over time. I watched a pod holding 2,000 connections for several hours. Flat. No slow leak, no growth. That gave me the baseline for setting resource requests.
Sharding the Load
A single Deployment doesn’t give you stable, predictable identity per pod, and I needed that to shard credentials cleanly. So I moved to a StatefulSet, where each pod gets an ordinal (0, 1, 2, and so on) that stays stable across restarts.
Credentials lived in MongoDB. Each pod computed its own slice of the credential set using its ordinal: ordinal * limit, then skip that many records. No coordination between pods, no locking, no risk of two pods picking up the same credential and opening a duplicate connection. Every pod just knew, deterministically, which slice of the world was its own.
The math for 200,000 connections: a 5-node cluster, roughly 20 pods per node, 100 pods total at 2,000 connections each.
Resource requests came straight from the profiling above: the observed baseline, not a guess. Limits were set to 2x requests, and were rarely hit. CPU allocation per node was (total cores − 2, reserved for the OS and kubelet) ÷ pods on that node. And deliberately: no CPU limit at all. That wasn’t an oversight. It was a direct lesson from the v1 throttling failure: the entire first version died because CPU got capped at the worst possible moment. I wasn’t doing that again.
The 30-Minute Recovery Window
Each pod took around 30 minutes to fully establish its 2,000 connections, a direct consequence of that 10-second handshake pacing. That number mattered operationally more than almost anything else in this system.
With 100 pods spread across 5 nodes, losing one node meant losing 20 pods and 40,000 connections, instantly. 40k gone out of 200k puts you at 80% active: above the 75% floor, but only just. Kubernetes would reschedule those pods onto the remaining nodes, but they’d spend the next 30 minutes climbing back to full capacity. During that window, you’re flying close to the floor.
Losing two nodes at the same time would have been a different conversation. That would have dropped active connections to 60% and breached the contract. It never happened. I never lost more than one node at a time in two years. Worth saying plainly: that’s luck as much as it is design.
Watching It Without Prometheus
I skipped Prometheus and Grafana. For this scale, running as a solo operator, it was one more thing to maintain that I didn’t strictly need.
Every pod exposed a /metrics endpoint reporting its own connection count and state. All the StatefulSets sat behind a headless service, which gives you stable, predictable per-pod DNS: pod-0.service, pod-1.service, and so on. A small Python script polled every pod by ordinal over that headless service and aggregated the numbers.
k3s liveness probes on each pod watched that same number. If a pod’s active-connection percentage dropped below 70%, it got restarted. And instead of running a separate always-on aggregator dashboard, I checked status on demand: a slash-command style trigger that fanned out across every pod and pulled the live numbers back on request. Simple, and exactly as much tooling as the problem needed. No more.
The Rewrite That Mattered Most
For a while, the TypeScript client was fighting the runtime the entire way. I read through the source of an open-source Go WebSocket client library, stripped out the caching layer and the event-dispatch machinery I didn’t need for this use case, and kept just the raw connection management.
The result: the active-connection rate went from 75% up to 90–95%, with some individual pods hitting 99%. This was the single biggest lever in the whole two years: bigger than the cluster topology, bigger than the resource tuning. Understanding a library well enough to fork it and gut it, rather than just consuming it as-is, was worth more than any infrastructure change I made.
I don’t have exact numbers for the CPU or RAM delta before and after that rewrite. I’d rather say that plainly than invent a figure that sounds more precise than what I actually measured.
Cost, Briefly
An equivalent 5-node cluster (12 cores, 64GB RAM per node) on DigitalOcean’s dedicated-CPU droplets runs roughly $3,000–3,350 a month in compute alone, at current pricing. The actual cluster, on Hetzner AX-41 bare metal, ran about $200 a month for all five nodes. Real dedicated hardware, not shared, at roughly a fifteenth of the cost.
I’m not presenting bare metal as a universal recommendation. It fit this workload’s specific tradeoffs: long-lived connections, predictable load, a solo operator who could own the hardware layer. It’s not a rule for every project.
What the Floor Actually Taught Me
Two years, one hard number to hold, and the lessons that mattered weren’t really about Kubernetes.
The 75% floor did the work that a vague uptime goal never would have. It forced every decision (no CPU limits, the StatefulSet sharding, the 30-minute recovery math, even skipping Prometheus) to be justified against a number I couldn’t negotiate with. A soft target lets you round up. A contractual floor doesn’t.
The single biggest win wasn’t infrastructure at all. It was reading someone else’s library closely enough to know exactly what to remove. That’s a different skill than provisioning nodes or writing YAML, and it’s the one I’d tell anyone with a similar problem to invest in first.
And the honest caveat stands: I never lost two nodes at once. Outside planned maintenance, the floor held for two years partly because I built it to hold, and partly because I never got unlucky enough to find out what would have happened if I had.